You understand Battery Management and Why It Matters, but now you need to know how much of an impact does your app have on a device. To do that you’ll need to be able to measure power consumption and resource utilization. Thankfully, for Android, there is a powerful tool to do just that.
In this article we will focus on how to measure the impact of your app on a device through Battery Historian. Along the way we will cover: basic installation, retrieving device reports, reading the data, and some basic test plans.
Setup
The simplest way to get started with Battery Historian is through Docker. If you are on a Mac and using Homebrew you can install it using the cask install command.
brew cask install docker
Once docker is installed, you can run the following command from the terminal and replace <port> with a port of your choice. The first time running Battery Historian, the docker image will be downloaded locally before it runs.
docker run -p <port>:9999 gcr.io/android-battery-historian/stable:3.0 --port 9999
After the command successfully executes the prompt should say Listening on port: 9999

We use Battery Historian enough, we defined an alias to simplify the process.
alias batteryhistorian='docker run -p 9999:9999 gcr.io/android-battery-historian/stable:3.0 --port 9999'
If you are running Linux or Mac you can open Battery Historian in a browser by going to http://localhost:<port>. If you are running a Windows machine you’ll need to identify the ip address Docker is running as and open http://<dockerip>:<port>.
Now we have Battery Historian waiting patiently for us while we prepare to dig into a day in the life of our subject. Grab the Android device that you want to investigate and make sure it has USB debugging enabled. This article also assumes you have adb, the Android Debug Bridge, installed.
Connect your device and open a new terminal session. Your last session should be running Battery Historian. For Android 6.0 or earlier use the adb bugreport > command.
adb bugreport > myreport.txt
For Android 7.0, drop the redirect operator, >, and change the extension to .zip.
adb bugreport myreport.zip
I’m using myreport.txt and myreport.zip in this example. For production testing it isn’t uncommon to have numerous report files in a day, so feel free to name them accordingly. We also want to be able to refer back to older bugreports for benchmarking, so we can quantitatively measure our changes. We might name a report based on the device and test we are running to make retrieving the report easier at a future date.
Reviewing the Report
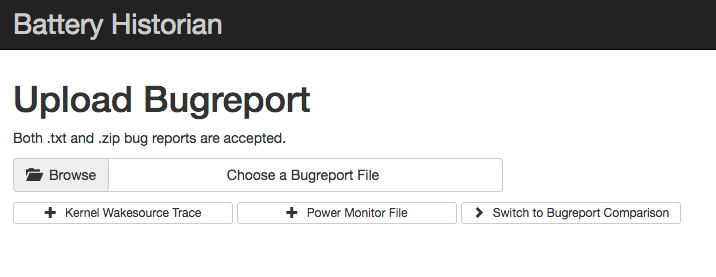
Now that we have a bugreport to work with, we can open up our browser session and select the bugreport by clicking the Browse button next to Choose a Bugreport file
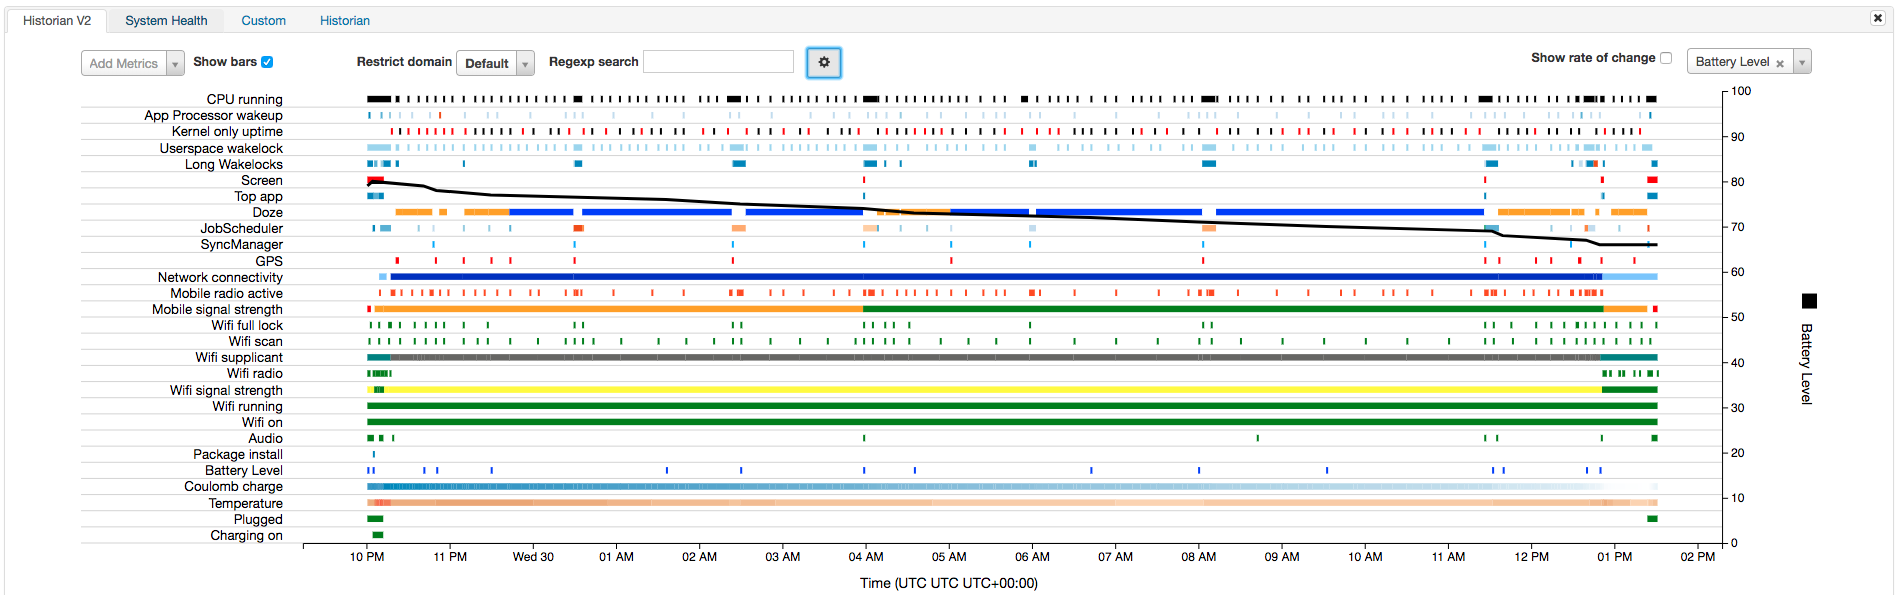
After the bugreport loads, you’ll be hit with the main log view screen. If you feel a bit overwhelmed, don’t be! There is a lot going on here, but for good reason. Mobile devices are busy. They are doing a lot behind the scenes, and this report gives you a peak behind the curtain. It also gives you a simple way to see information for a specific application, but we will get to that later.
Device Overview
If you are following along you might be saying, “hey my report doesn’t look like yours.” That’s ok, you will find that the report can look a little different based on device, device capabilities, and events that occurred during the logging period. Older devices tend to report a little less information, but generally they all provide the critical information.
The graph has some interesting information to provide a general feel for the device stability and performance. First let’s talk about the black line that is overlaid on top of the rows of data. By default this is the Battery line. This line represents the state of charge on the device’s battery. It is most useful when you know what was happening on the device at a given time. If you know something was being particularly strenuous on the battery at a specific time, you can put the battery consumption in perspective.
Next, we can look at the top line. In my experience, the top line is reserved for CPU Running. It may be surprising, but we usually don’t spend a lot of time worrying about this line. The CPU is used for a lot of things, so regular tick marks are normal. If we are performing UI testing, then solid black lines are normal. The main data elements we watch for on the graph usually include: the battery line, Doze, and JobScheduler. This data is great, but for app specific testing there are better ways to identify what is going on.
If you are investigating a specific device’s general performance or battery drain, you will be interested in the System Stats tab below the graph. Note: if the log you are viewing doesn’t have records for a particular field, they are not included in the report. Longer reports with more apps running may provide more details.
The system stats tab can provide both Screen On and Screen Off battery discharge rates. Wakelocks are a mechanism that prevents your device from entering deep sleep and turning the CPU off. Apps that are not properly disposing wakelocks will continue to run in the background, consuming battery until the OS terminates the app. You can see the total wakelock time for the device under Userspace Wakelock Time. Many of the records within System Stats are useful in identifying potential battery issues. Identifying system performance is fun, but you probably want to know how your app is doing.
App Details
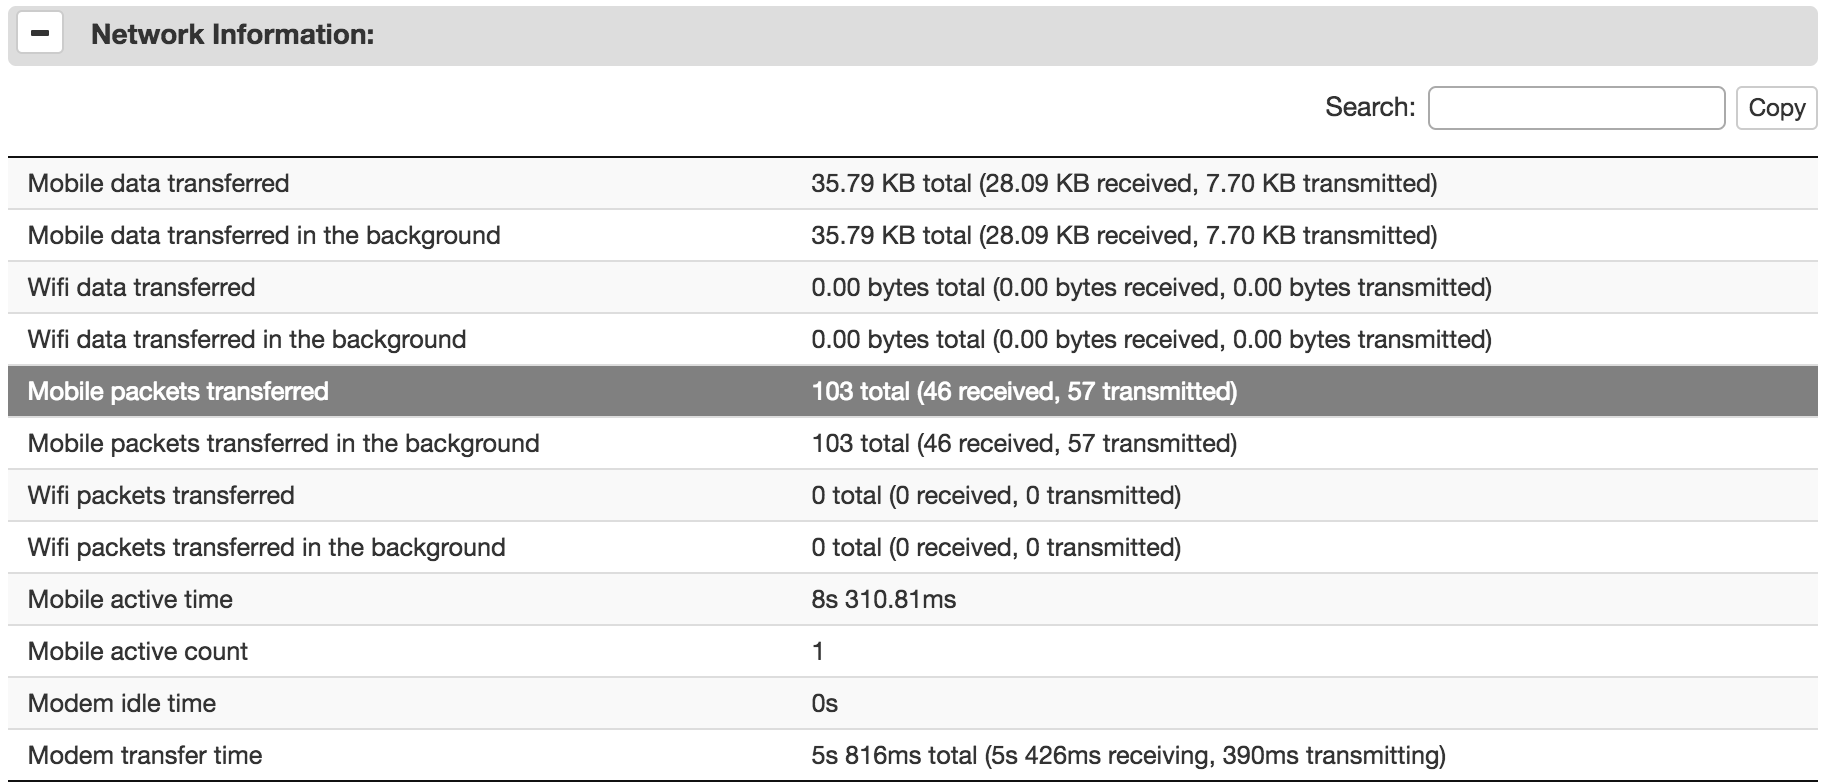
To the left of the System Stats tab, there is a set of drop downs. In the second dropdown you can select the namespace of your application. When you select your app, the App Stats tab to the right will contain only the specific information relating to the selected application.
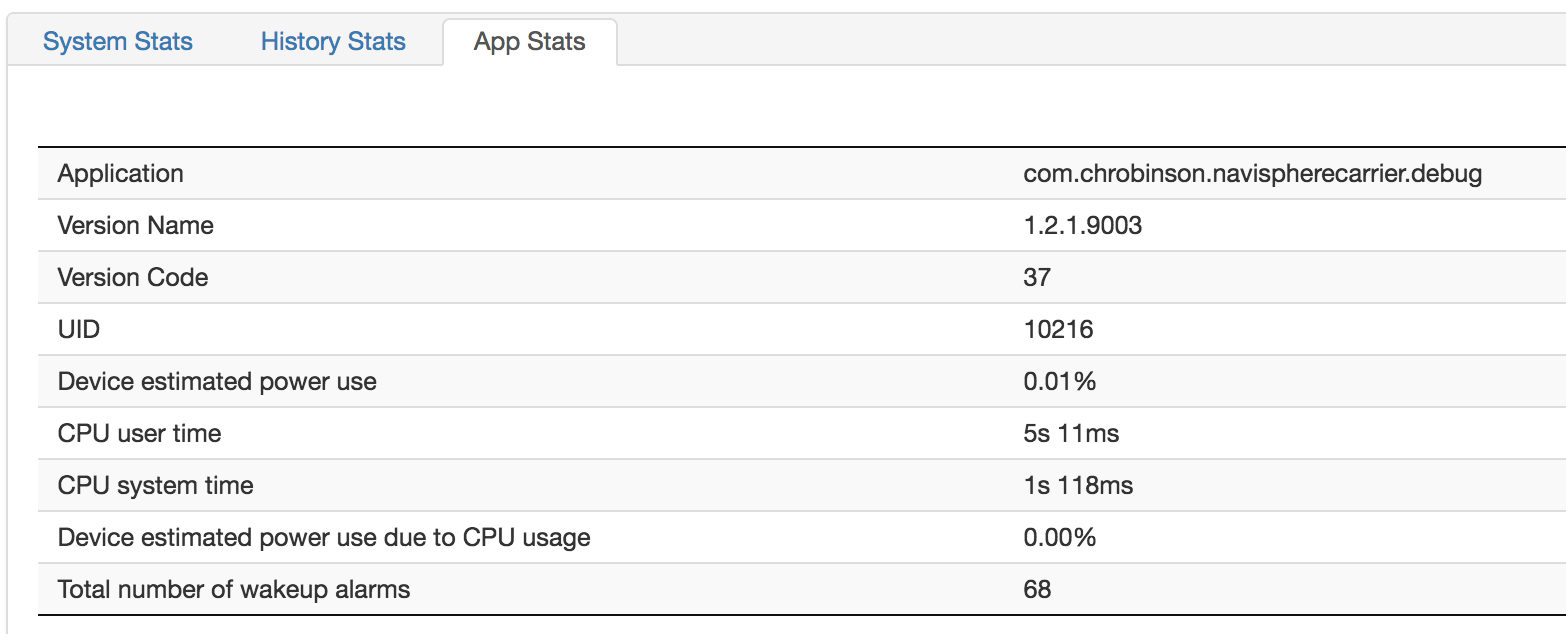
The App Stats page is a metaphorical gold mine when you want to minimize your app’s impact on a device’s battery use and data. Here you can diagnose a number of potential challenges, as well as find what your app does well. Review these stats and think about the impact they have on the device. Waking up radios consumes power, so does transferring/consuming data. Are you using sensors you didn’t expect? Are they staying awake longer than you thought? Can your app survive the leaky faucet test?
Leaky Faucet Test
When I first bought my home, I was told to try the “leaky faucet test.” It goes like this: right before bed make sure all faucets were turned off. Then record the reading from the water meter. When you wake up and before doing anything else, record the reading from the water meter. Any difference is the amount of leakage in your water system. The process is basically the same for Android apps. When you have time to allow the device to sit in various forms of idle state, connect the device and run the batterystats reset command in the terminal.
adb shell dumpsys batterystats --reset
As you might expect, this command clears the bugreport log and starts you with a clean slate. Wait eight or more hours. Then pull down a new bugreport file.
You may have noticed, I said “sit in various forms of idle state.” That is because we need to watch out for Doze Mode. Doze Mode is worthy of its own article. It is one of the mechanisms within Android to prevent battery abuse. We have found it is useful to perform the leaky faucet test on a device that is in the following states:
- completely idle while being charged
- completely idle without being charged
- app idle (e.g. we still use the phone, but don’t launch the app)
- idle, but in transit (such as in a backpack or purse)
Different versions of Android respond differently to these states. Different forms of background processing will also respond differently to these scenarios. For more detailed testing or debugging, use ADB to force the device into various states.
Working with the Data
Now that you have this plethora of valuable data, it’s time to put it to work. Review the data with your use cases in mind. What level of optimization does your app need? If you are doing little to no background processing, it is more valuable to focus on the basic optimizations. If your app needs to perform work in the background on a regular basis and you are trying to avoid being killed off by the OS battery limiters, you may need to take more extreme measures. Optimization often increases complexity, so optimize carefully and deliberately.
Parting Thoughts
This article focused on using Battery Historian from the perspective of an app that works in the background. Your reports and data will look different than ours, but they will provide the data you need to give your users the best experience. If you are using a resource on your user’s mobile device, take a look at your app through the lens of Battery Historian. Whether it is the camera, GPS, audio, Bluetooth or any other sensors on the device, they all need to be disposed properly. Your focus on what you optimize and how you optimize is dependent on the type of application you are building, as well as the expectations of your users.